

Overview
This module analyzes all loans with a funded date set, regardless of their current status. It is the primary view for understanding your production history and identifying trends.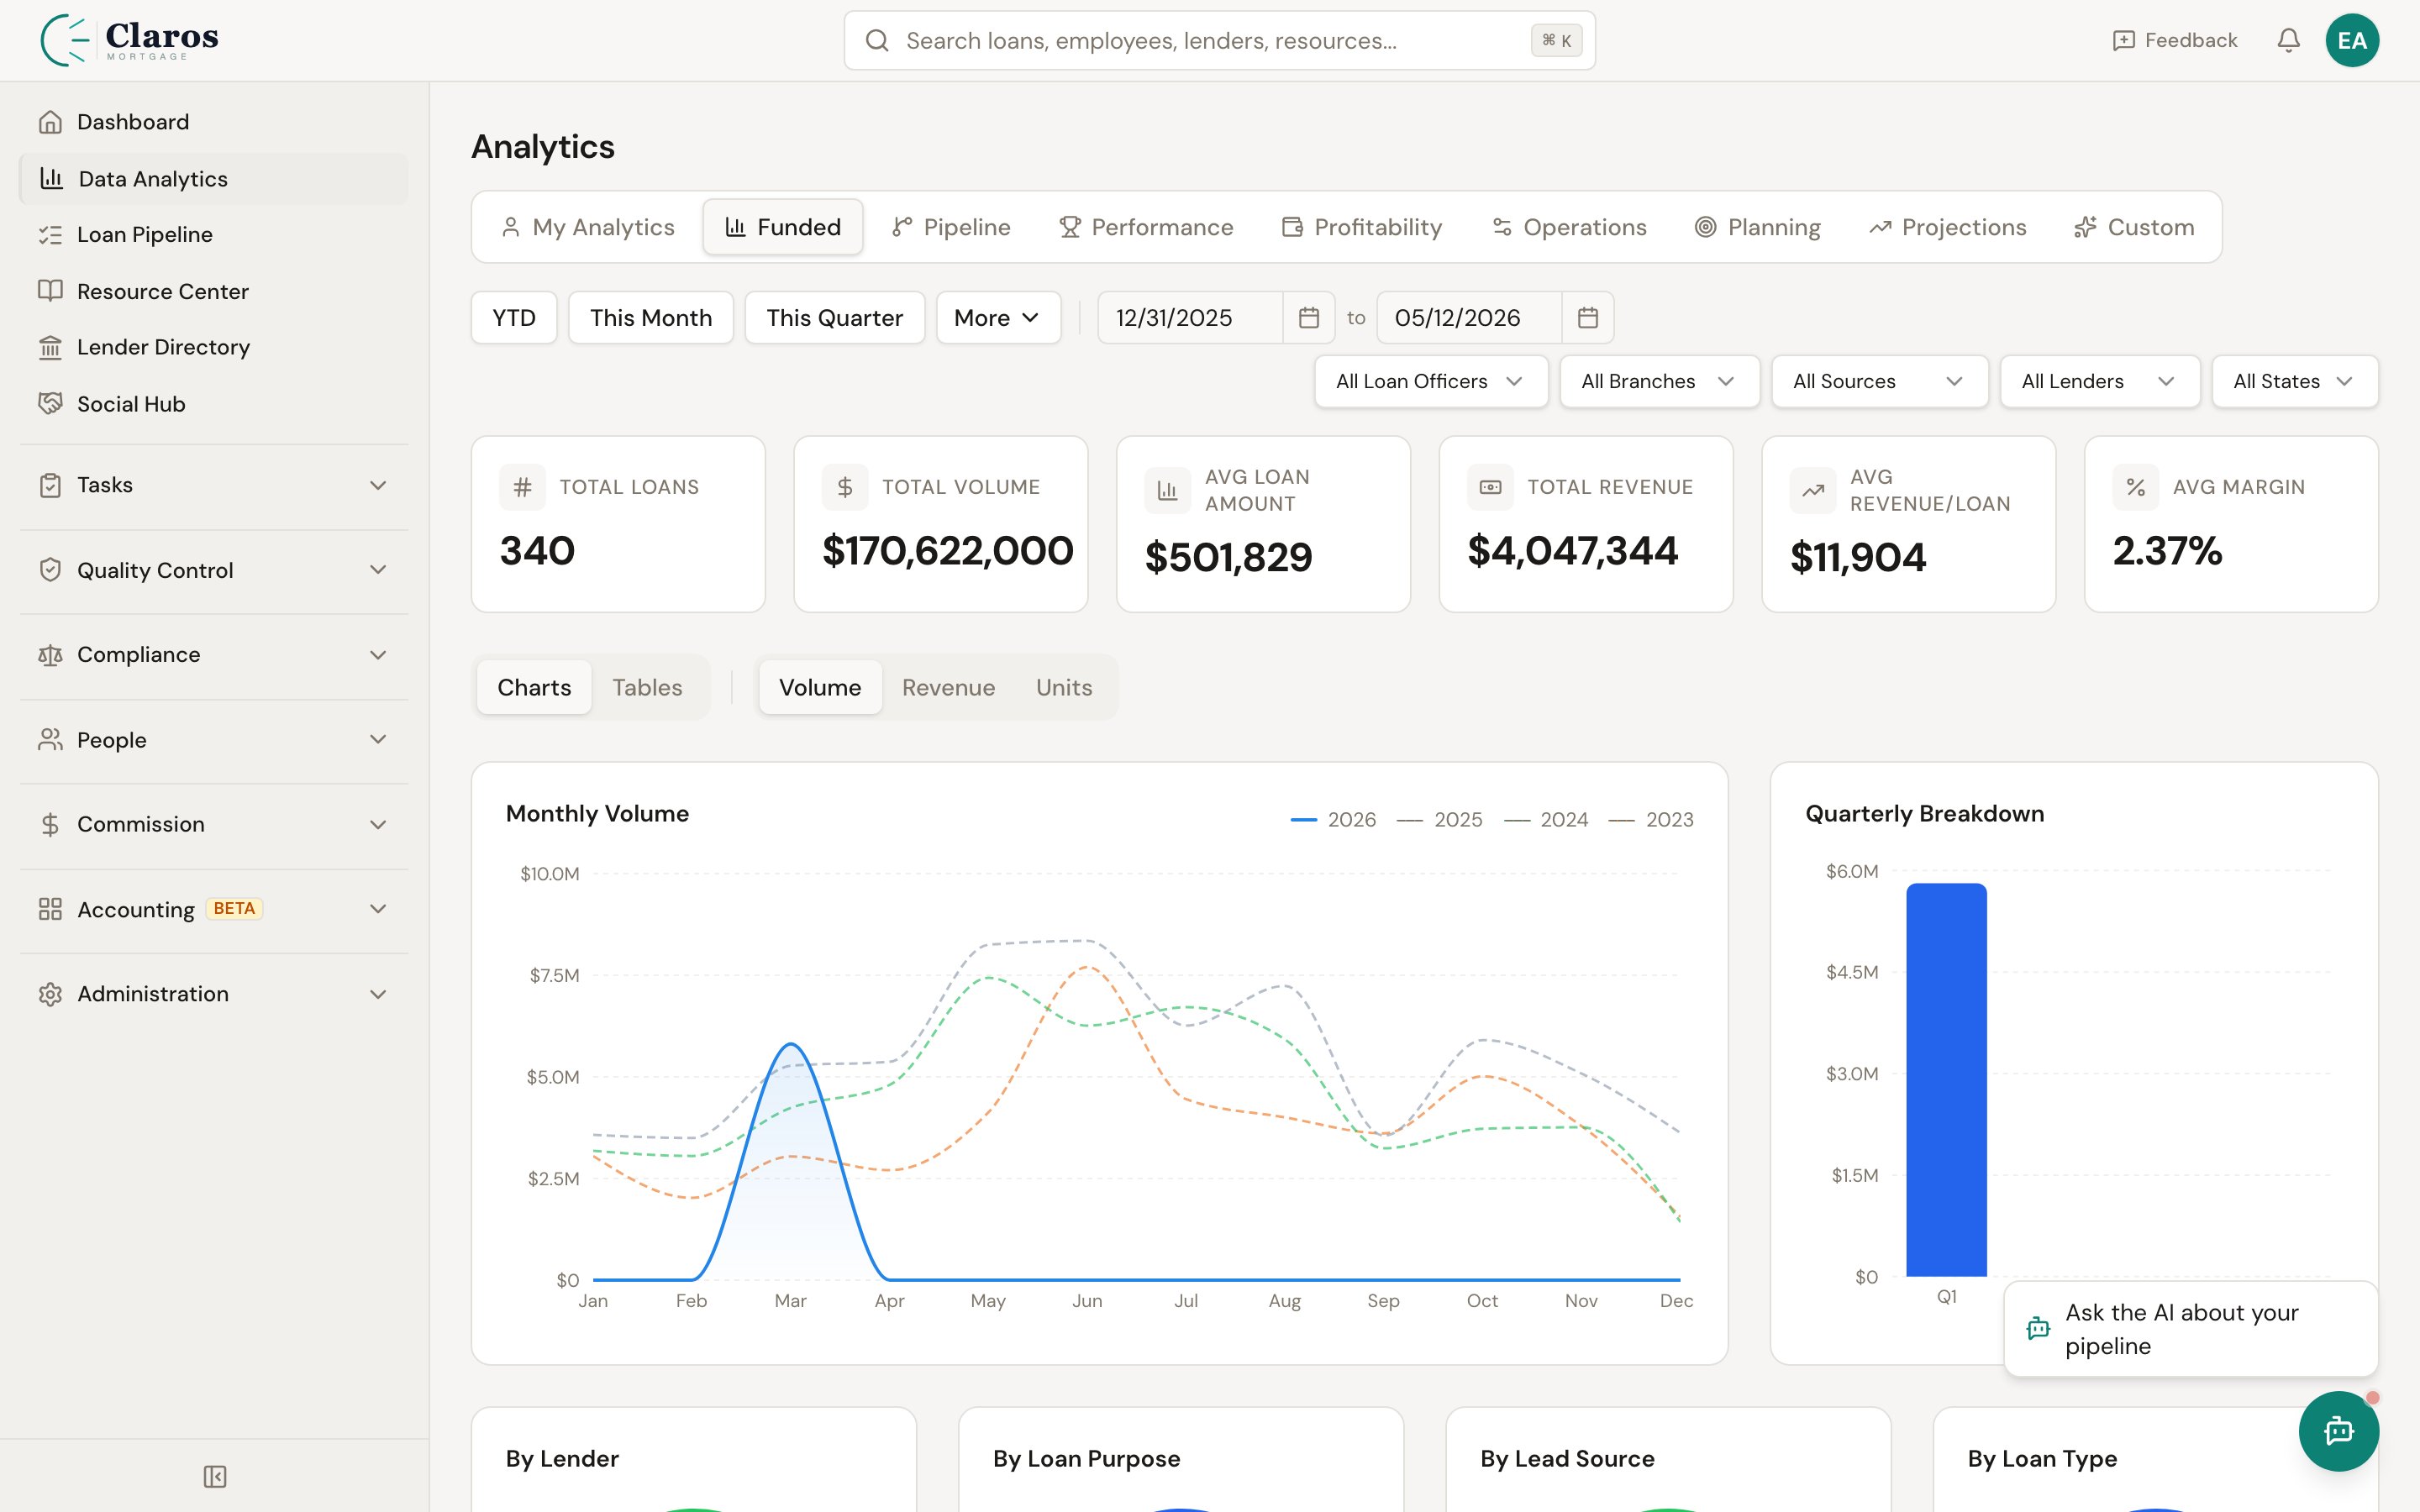
Summary KPIs
The top of the dashboard displays five key metrics for the selected period, each with a percentage change compared to the prior period of equal duration:Period-over-Period Comparison
When you set a date range, the system automatically calculates the prior period of the same duration. For example, if you select January 1 through March 31, the comparison period is the preceding October 1 through December 31. Each KPI shows the percentage change from the prior period, making it easy to spot growth or decline.Breakdown Views
The funded dashboard breaks down loan data across five dimensions:
Each breakdown shows:
- Name — The category (lender name, loan type, etc.)
- Units — Number of funded loans
- Volume — Total dollar volume
- Revenue — Total broker compensation
- % of Total — This category’s share of the total loan count
Monthly Trend Charts
Multi-year monthly trend charts let you compare production across years. The system detects all years present in your data and overlays them on the same chart, so you can spot seasonal patterns and year-over-year growth. Three chart views are available:
Each chart shows all 12 months (Jan through Dec) on the x-axis, with a separate data series for each year in your dataset.
Quarterly Breakdown
The quarterly view aggregates funded data for the most recent year into four quarters:LO Efficiency Metrics
The loan officer efficiency table measures how quickly each LO moves loans through the pipeline from submission to funding.
The table is sorted by total loans (most productive LOs first). Metrics that cannot be calculated (because the required date fields are not populated) show as null.
Filtering
Funded loan analytics support filtering by:- Date Range — Start and end dates to scope the analysis period
- Loan Officer — Filter to a specific LO’s funded production