Documentation Index
Fetch the complete documentation index at: https://docs.keystn.com/llms.txt
Use this file to discover all available pages before exploring further.
Overview
The performance leaderboard gives managers a single view to assess how each loan officer is performing. It combines production metrics (volume, units, revenue) with operational efficiency (pull-through, speed) and financial health indicators (draw balance), making it easy to identify top performers and those who may need support.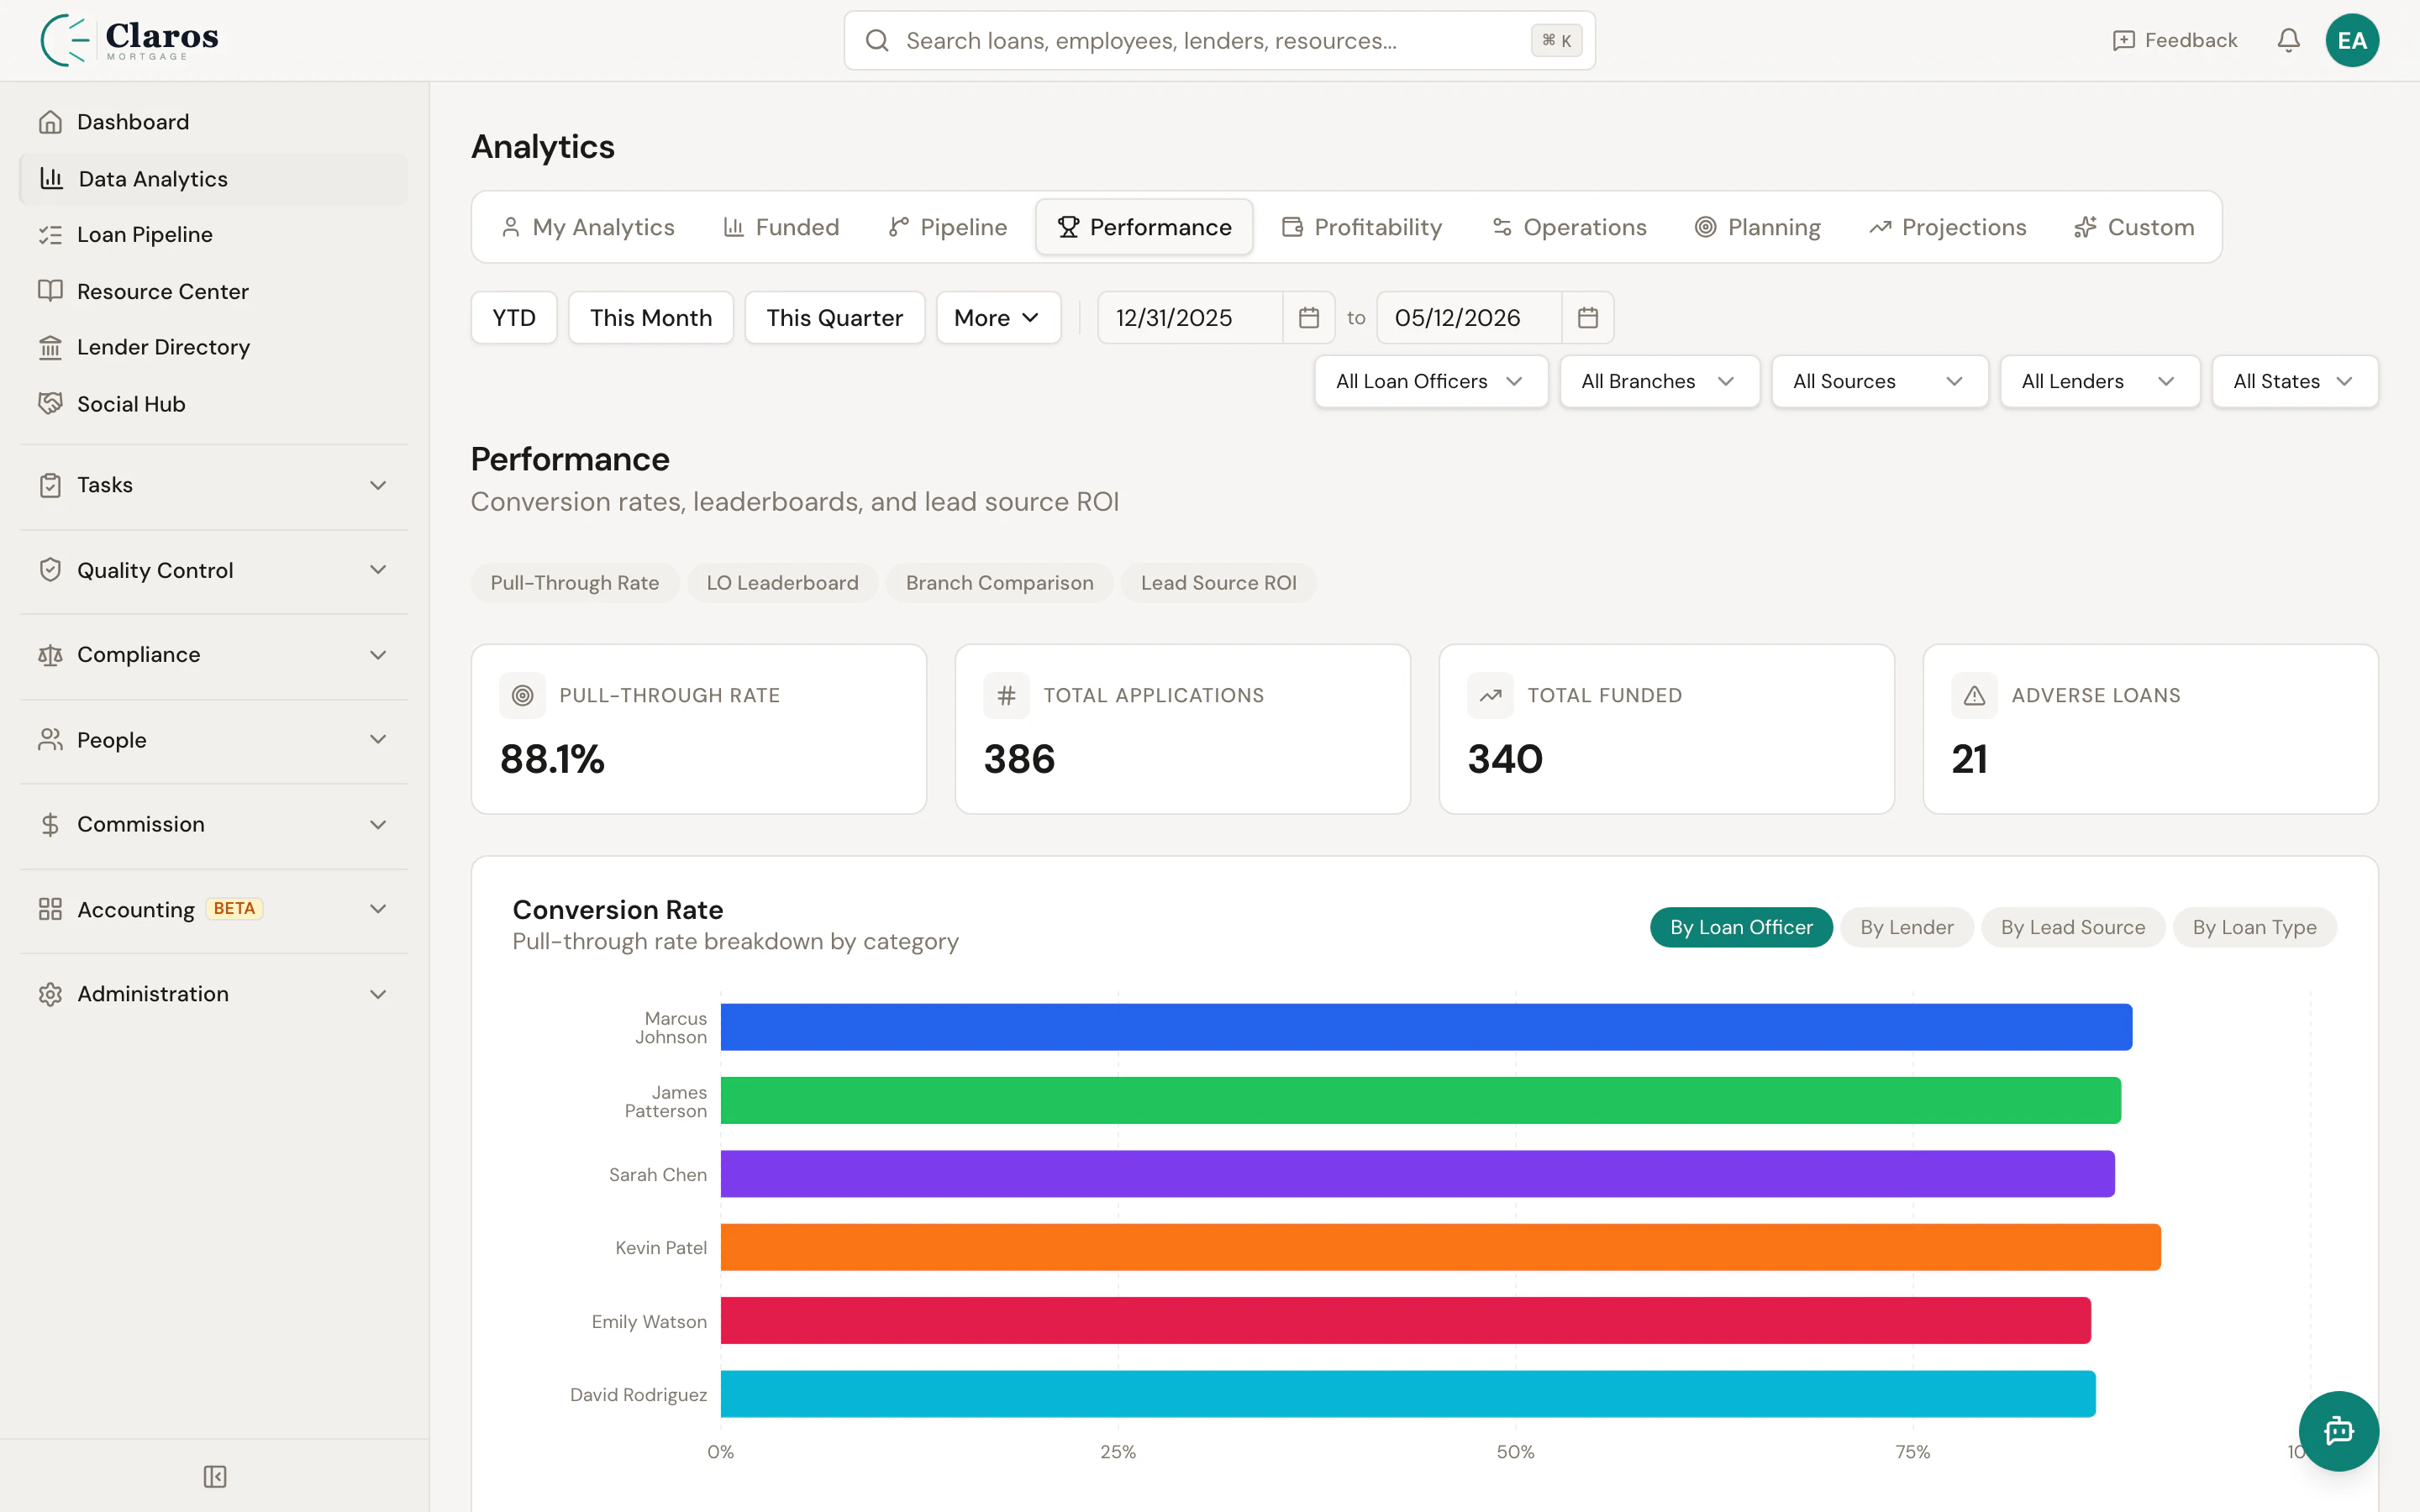
Leaderboard Metrics
Each loan officer row in the leaderboard displays the following metrics:| Metric | Description |
|---|---|
| Name | Loan officer’s full name |
| Volume | Total funded loan volume in the selected period |
| Units | Number of funded loans |
| Revenue | Total broker compensation earned |
| Pull-Through | Percentage of applications that resulted in a funded loan. Calculated as (Funded Loans / Total Applications) x 100. |
| Avg Days to Fund | Average number of calendar days from App Intake to Funded Date. Shows null if no loans have both dates populated. |
| Volume Change | Percentage change in volume compared to the prior period of equal duration. Helps identify trending up or down. |
| Draw Balance | Current draw balance for the LO, pulled from the employee record. |
| Draw Alert | A warning flag that appears when the LO’s draw balance exceeds their estimated monthly earnings, indicating they may not be producing enough to cover their draw. |
Sorting
The leaderboard is sorted by funded volume in descending order, so the highest-producing LOs appear at the top. All active loan officers are included, even those with zero funded loans in the period, ensuring a complete view of the team.Pull-Through Rate
Pull-through rate measures conversion efficiency — what percentage of applications a loan officer successfully closes. It is calculated by:Volume Change
When a date range is set, the system calculates the LO’s funded volume for the equivalent prior period and shows the percentage change:- Positive — Volume increased compared to the prior period
- Zero — Volume stayed the same
- Negative — Volume decreased
Draw Balance Alerts
The draw alert system identifies loan officers whose draw balance may be outpacing their earnings. The alert triggers when:Filtering
The performance leaderboard supports filtering by:| Filter | Description |
|---|---|
| Date Range | Scope the analysis to a specific time period |
| Loan Officer | Focus on a single LO (useful for detailed review) |
| Branch | Filter to loan officers in a specific branch |
| Lead Source | Filter by the lead source on funded loans |
| Lender | Filter by the lender on funded loans |
Using Performance Data
Weekly Sales Meetings
Use the leaderboard during weekly sales meetings to review:- Who is on pace for their targets
- Which LOs saw volume increases or decreases
- Pull-through rates that may indicate coaching opportunities